

BMI for children and teenagers is a percentile.
Why children's BMI is compared with others of the same age and sex, how the CDC's percentiles and its 2022 extended charts work, and the bands.
By Suraj Kumar3 min read
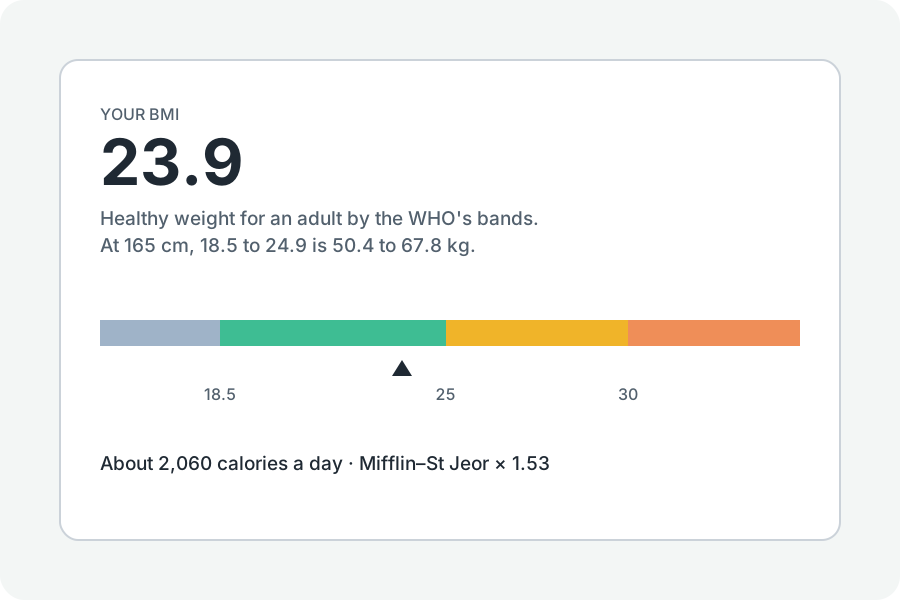
A child's BMI is worked out as an adult's is, but read against other children of the same age and sex.
A percentile.
The CDC's charts give, for each half month from 2 to 20 years, three numbers (L, M and S) that turn a BMI into a percentile. The 60th percentile means a BMI above 60 of every 100 children of that age and sex in the reference.
The extended charts.
The 2000 charts stop at the 97th percentile. In 2022 the CDC extended them for children with obesity: above the 95th, the percentile is 90 plus 10 times the normal distribution of the distance above the 95th, scaled by an age-based σ. The page works this out as the CDC's own program cdcanthro does.
The bands.
Below the 5th percentile is underweight, the 5th to below the 85th a healthy weight, the 85th to below the 95th overweight, and the 95th or more obesity. At 120% of the 95th percentile or a BMI of 35, the CDC calls it severe obesity. A doctor reads these with the child's growth over time.
Further reading
Topics: bmi calculator for kids · child bmi percentile · bmi for age · cdc growth charts · teen bmi
A little less theory. A little more doing.
Try it on your own terms, with a free browser tool.
Try the tool