

Choosing the right graph.
Which graph suits your numbers: bars to compare, lines over time, a pie for parts of a whole, a scatter for two numbers. Make it in your browser.
By Suraj Kumar2 min read
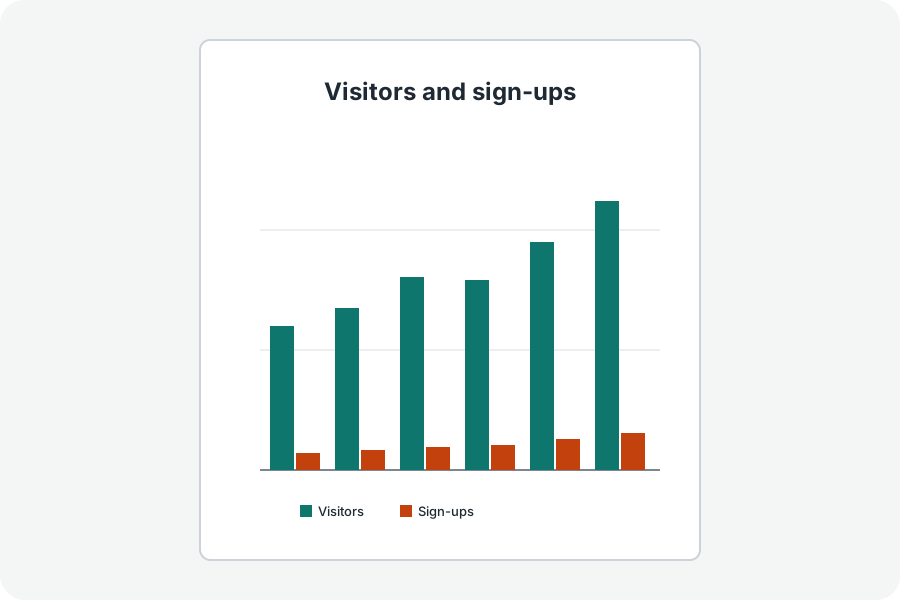
The right graph makes the point for you.
Compare: bars.
Bars compare amounts side by side.
Over time: lines.
A line shows how something changed from one point to the next.
Parts and pairs.
A pie shows parts of a whole; a scatter shows how two numbers relate, the first column across and the others up.
Further reading
Topics: graph maker · which chart to use · types of graphs · scatter plot maker · make a graph
A little less theory. A little more doing.
Try it on your own terms, with a free browser tool.
Try the tool