

Making a bar graph.
Make a bar graph in your browser from a table you paste or open, one colour for each column, saved as PNG, SVG or PDF. Nothing uploaded.
By Suraj Kumar2 min read
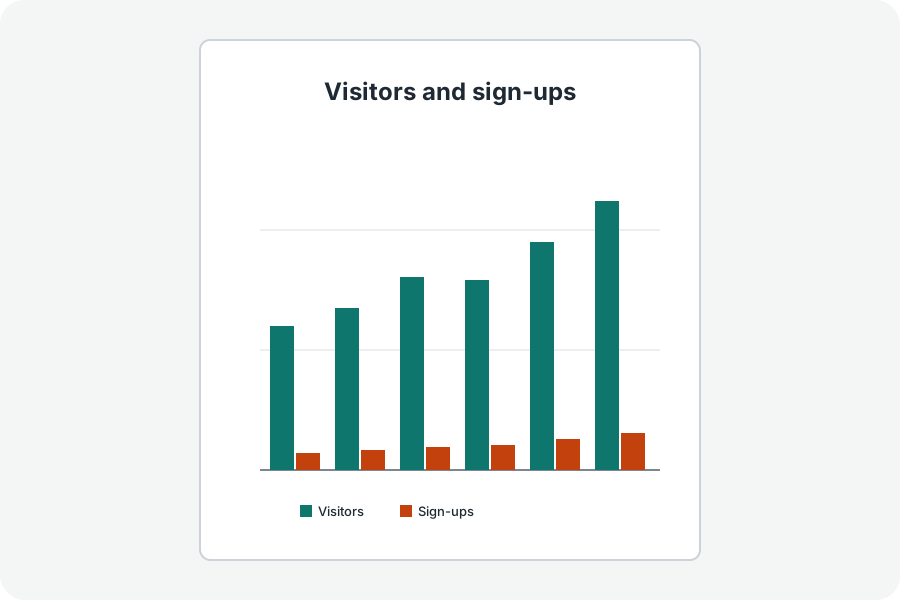
Bars compare amounts at a glance.
From a table.
Copy cells from a spreadsheet and paste them: the first column names each bar, and each other column becomes a colour, side by side.
Starting at zero.
A bar's length stands for its amount, so the scale always starts at zero.
Numbers on the bars.
Each bar's number is written above it when there is room; turn it off under More options.
Further reading
Topics: bar graph maker · bar chart maker · column chart · make a bar graph · grouped bar chart
A little less theory. A little more doing.
Try it on your own terms, with a free browser tool.
Try the tool