

Making a pie chart.
Make a pie or donut chart from a list of amounts in your browser, each slice with its share in percent, saved as PNG, SVG or PDF.
By Suraj Kumar2 min read
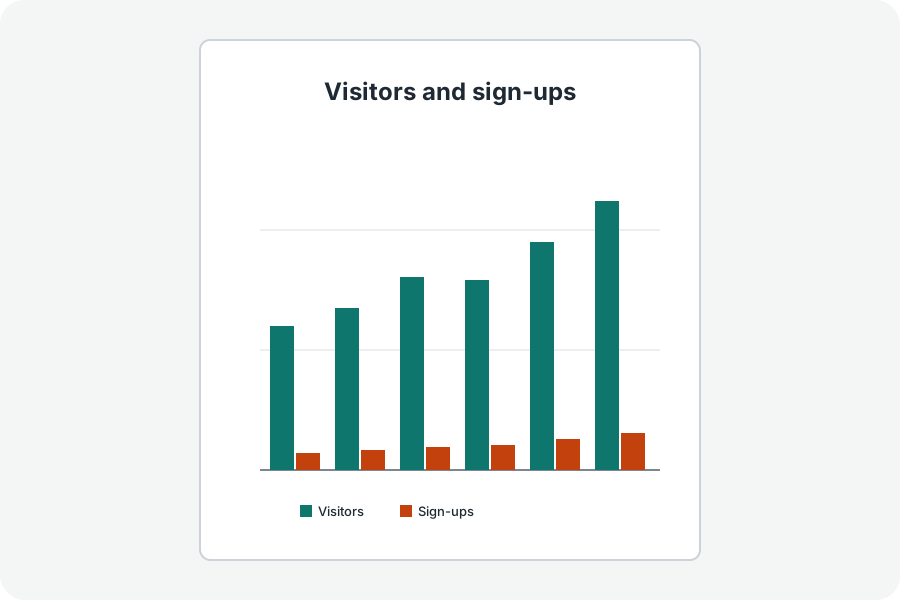
A pie shows parts of a whole.
What a pie cannot show.
Amounts below zero have no place in a whole, so they are left out and the page says so; use bars to compare them.
A donut.
Choose Donut under More options for a ring with the total in the middle.
Further reading
Topics: pie chart maker · pie chart with percentages · donut chart maker · make a pie chart · pie graph
A little less theory. A little more doing.
Try it on your own terms, with a free browser tool.
Try the tool