

One chart, three files.
Make a bar, line, pie or scatter chart from numbers you paste or open, drawn once and saved as PNG, SVG or PDF. Nothing uploaded.
By Suraj Kumar2 min read
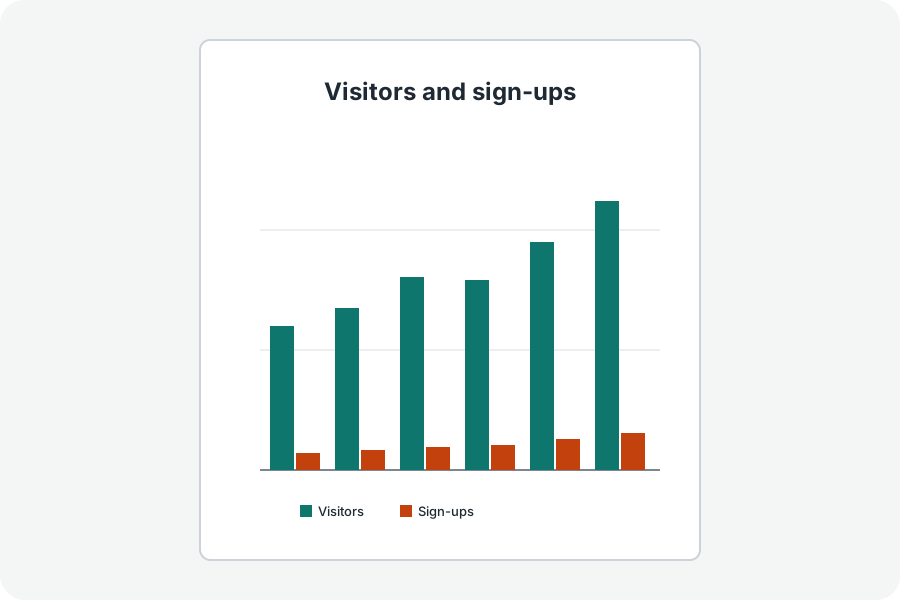
A chart should look the same in every file you save.
Drawn once.
The chart is laid out once as shapes, with its words as the outlines of the site's own fonts; the preview, the PNG, the SVG and the PDF are all made from that one drawing.
Your numbers.
Paste from a spreadsheet or type rows with commas; a CSV or Excel file is read on your device. The first column names each row, and each other column is a colour.
Colours that show.
Each colour is held to 3:1 against the white page, and the chart's description is given to screen readers.
Further reading
Topics: chart maker · graph maker · make a chart online · chart generator · save chart as pdf
A little less theory. A little more doing.
Try it on your own terms, with a free browser tool.
Try the tool