

Diagrams you can type.
How to write a Mermaid flowchart: direction, node shapes, arrows, labels and subgraphs. Then turn it into a diagram you can edit, in your browser.
By Suraj Kumar5 min read
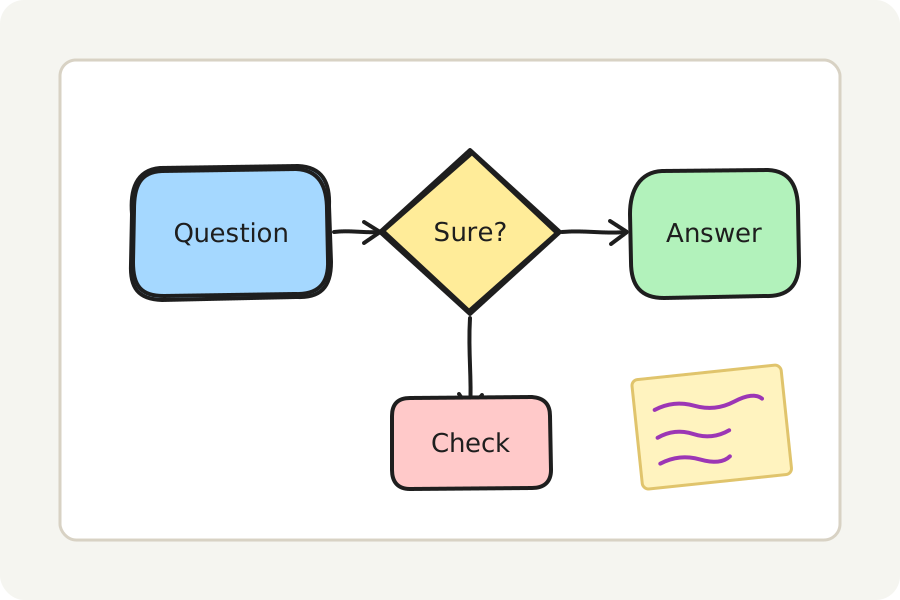
Mermaid draws diagrams from text, so a flowchart can live in a README, a pull request or a Markdown note and change with a line of typing. The syntax fits on a page. Here it is, with how to turn the text into a diagram you can move by hand.
Start with a direction.
A flowchart starts with flowchart (or the older graph) and a direction: TB or TD for top to bottom, BT for bottom to top, LR for left to right and RL for right to left. Each line after it is a node, a link, or both.
flowchart LR
  start([Order placed]) --> paid{Paid?}
  paid -->|Yes| ship[Ship it]
  paid -->|No| remind[Send a reminder]
  remind -.-> paid
Shapes, by their brackets.
A node is an id followed by its words in brackets, and the brackets give the shape. Write the id once with its words, then use the id alone. Words with brackets or other special characters in them go in double quotes: A["Total (all)"].
A[Rectangle]     a step
B(Rounded)       a rounded step
C([Stadium])     a start or an end
D{Diamond}       a question
E((Circle))      a point
F[(Database)]    a store
G{{Hexagon}}     a preparation
Arrows and lines.
Links are drawn with dashes: more of them makes a longer link. Words go on a link between bars, or between the dashes. A line can chain several links, A --> B --> C, and & joins several nodes at once: A & B --> C.
A --> B          an arrow
A --- B          a line, no head
A -.-> B         a dotted arrow
A ==> B          a thick arrow
A --o B          a circle at the end
A --x B          a cross at the end
A <--> B         arrows at both ends
A -->|Yes| B     words on the arrow
A -- Yes --> B   the same, written another way
A ~~~ B          an invisible link, for layout
Group with subgraphs.
A subgraph draws a box round the nodes between its first line and end, with its title on the box. Links can go into and out of it like any other.
flowchart TB
  subgraph Warehouse
    pick[Pick] --> pack[Pack]
  end
  order[Order] --> pick
  pack --> post[Post]
From text to a diagram you can move.
Paste the text into Mermaid to diagram, which opens the whiteboard's diagram window. Mermaid itself reads it, in its strict mode, and lays it out, and each node becomes a shape on the board: rectangles (rounded for round and stadium nodes), diamonds for questions and ellipses for circles. Other shapes, such as the database and the hexagon, become rectangles. Links become arrows that stay joined to their shapes, dotted or thick, with circles or bars at their ends where Mermaid has them, and subgraphs become frames. Invisible links and a node linked to itself are left out.
Only flowcharts become shapes: a sequence diagram, a Gantt chart or any other kind goes on the board as one picture, and the window says so. Save the board as PNG, SVG or PDF, or as an .excalidraw file to change later. Nothing is uploaded. In the Markdown editor, a block that starts with ```mermaid is drawn in the preview.
Further reading
Topics: mermaid flowchart syntax · mermaid flowchart · mermaid arrow types · mermaid node shapes · mermaid subgraph · mermaid diagram example · mermaid to png · mermaid cheat sheet
A little less theory. A little more doing.
Try it on your own terms, with a free browser tool.
Try the tool